Skip to content

Analytics and funnels

Outreach analytics and funnels, with the counts behind every rate

Today shows what needs you and whether outreach is healthy this week. Funnels show how far people get from import to a reply, a meeting or a won deal, for the whole workspace, one campaign or one list.

Does the job ofa spreadsheet of campaign numbers

The Funnels page showing the built-in Outreach funnel for the last 7 days. A highlighted biggest leak says 225 of 412 leads that reached request sent did not get further. The table lists each stage from Lead imported at 468 to Replied at 31 with reached counts, step conversion, share of all leads and a bar for where leads are now.The Funnels page showing the built-in Outreach funnel for the last 7 days. A highlighted biggest leak says 225 of 412 leads that reached request sent did not get further. The table lists each stage from Lead imported at 468 to Replied at 31 with reached counts, step conversion, share of all leads and a bar for where leads are now. Shown in the dark theme.

What it does

See how far people get, and where they stop.

  1. Today

    A ranked Needs you list, key numbers with their counts, one activity chart, your funnel, your campaigns and each LinkedIn account's capacity today.
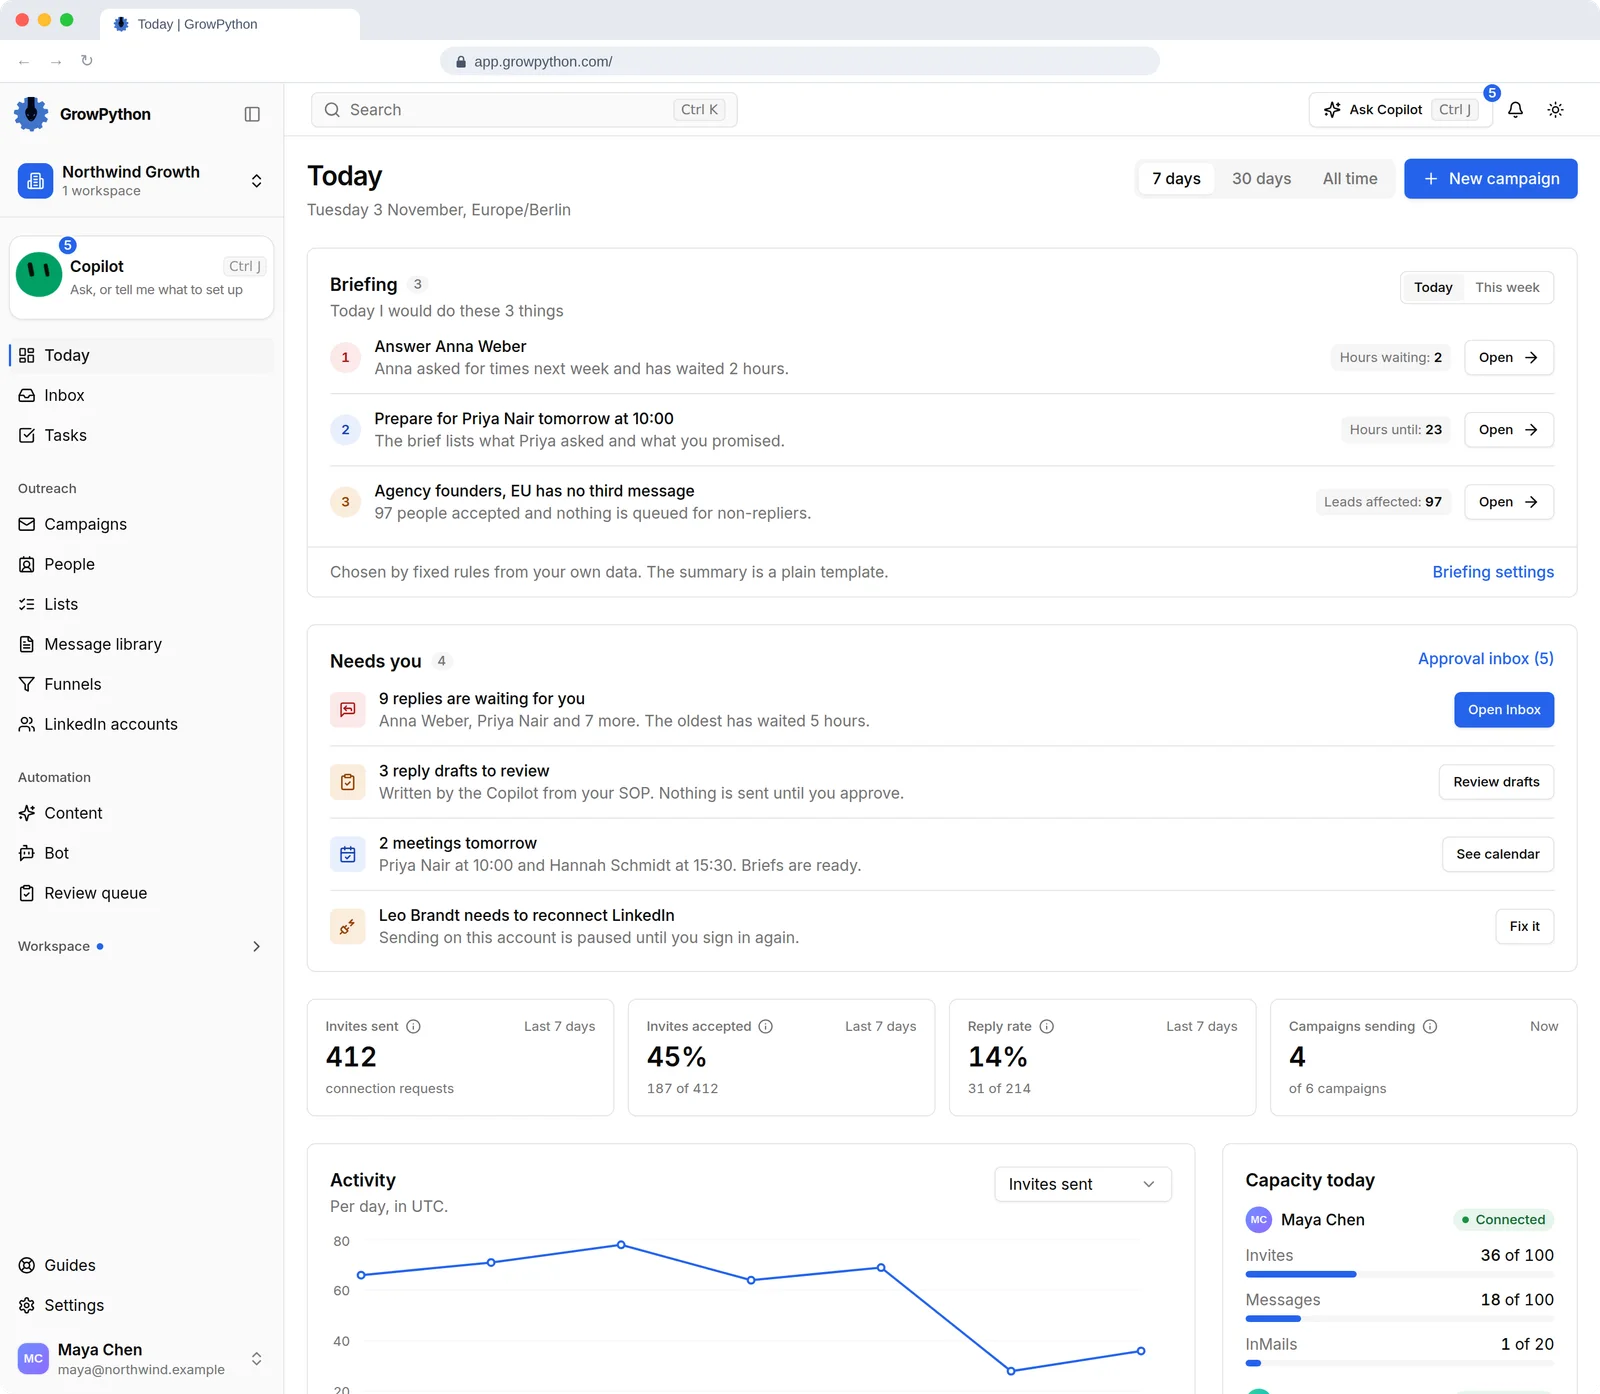
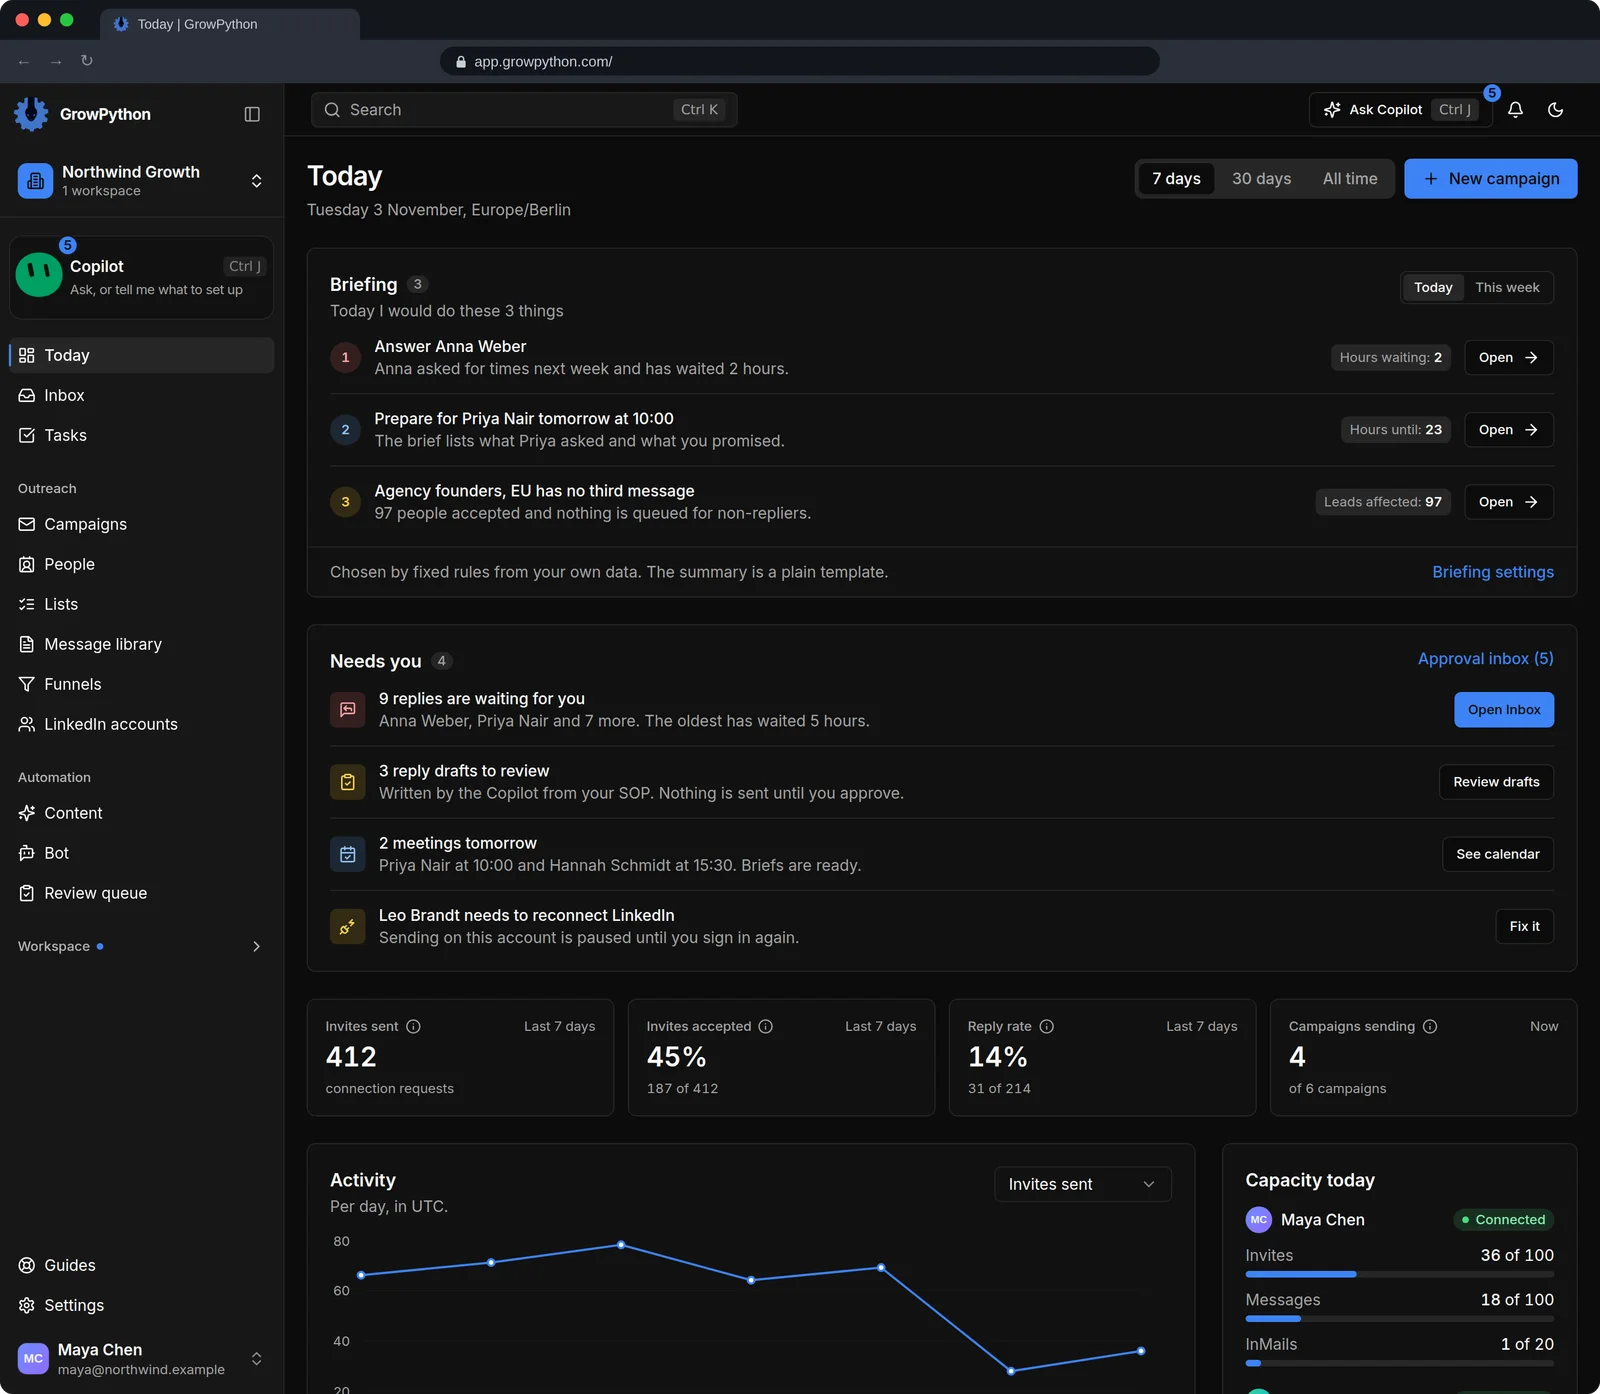
    The Today page of the GrowPython app for the demo workspace Northwind Growth. A briefing lists three things to do, a Needs you list shows five waiting replies and three drafts to review, four tiles show 412 invites sent, 45 percent accepted, a 14 percent reply rate and four campaigns sending, with an activity chart, an outreach funnel and daily capacity per LinkedIn account below.The Today page of the GrowPython app for the demo workspace Northwind Growth. A briefing lists three things to do, a Needs you list shows five waiting replies and three drafts to review, four tiles show 412 invites sent, 45 percent accepted, a 14 percent reply rate and four campaigns sending, with an activity chart, an outreach funnel and daily capacity per LinkedIn account below. Shown in the dark theme.
  2. The outreach funnel

    How far leads get from import to a reply, a meeting or a won deal, for the workspace, one campaign or one list, over a range you pick.
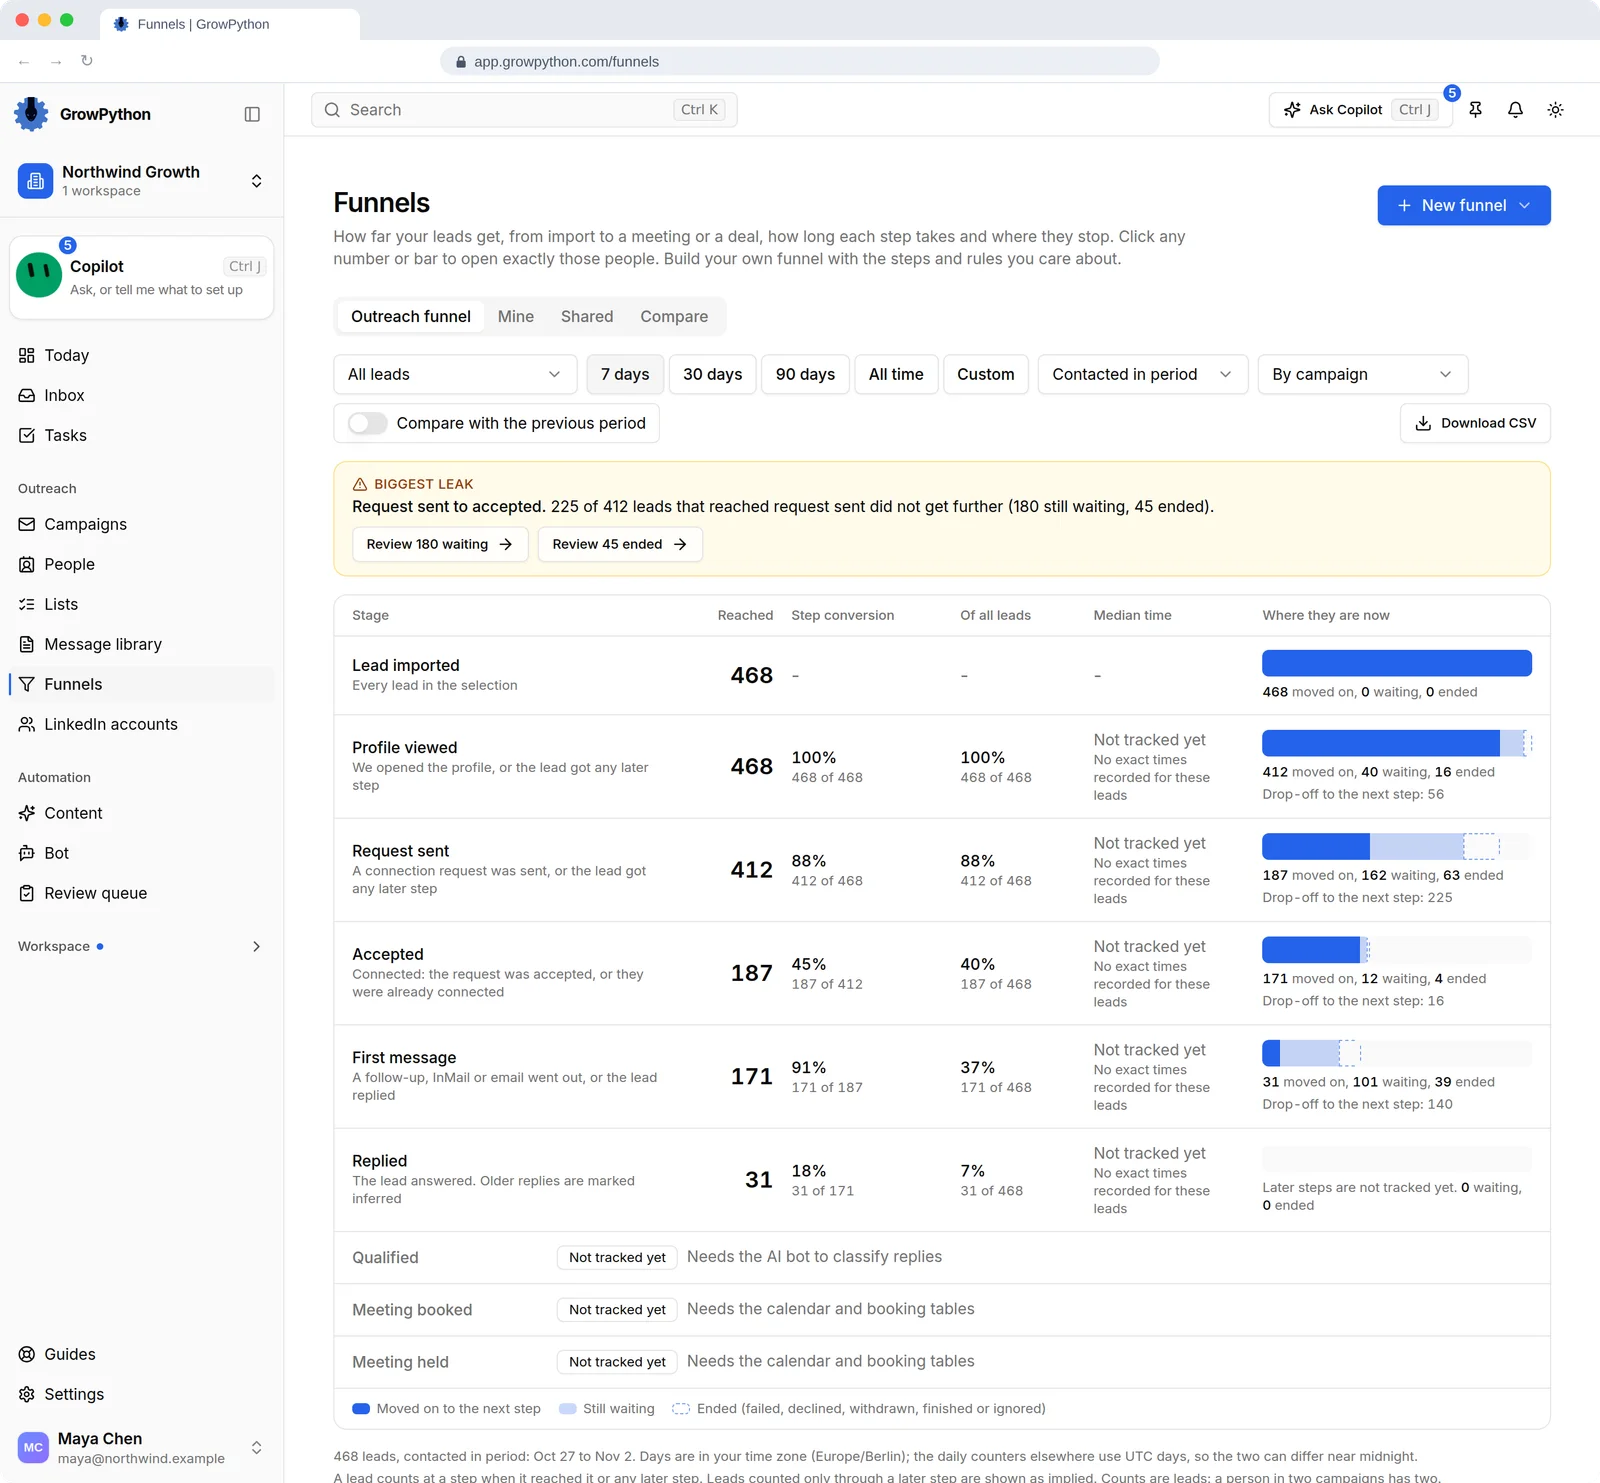
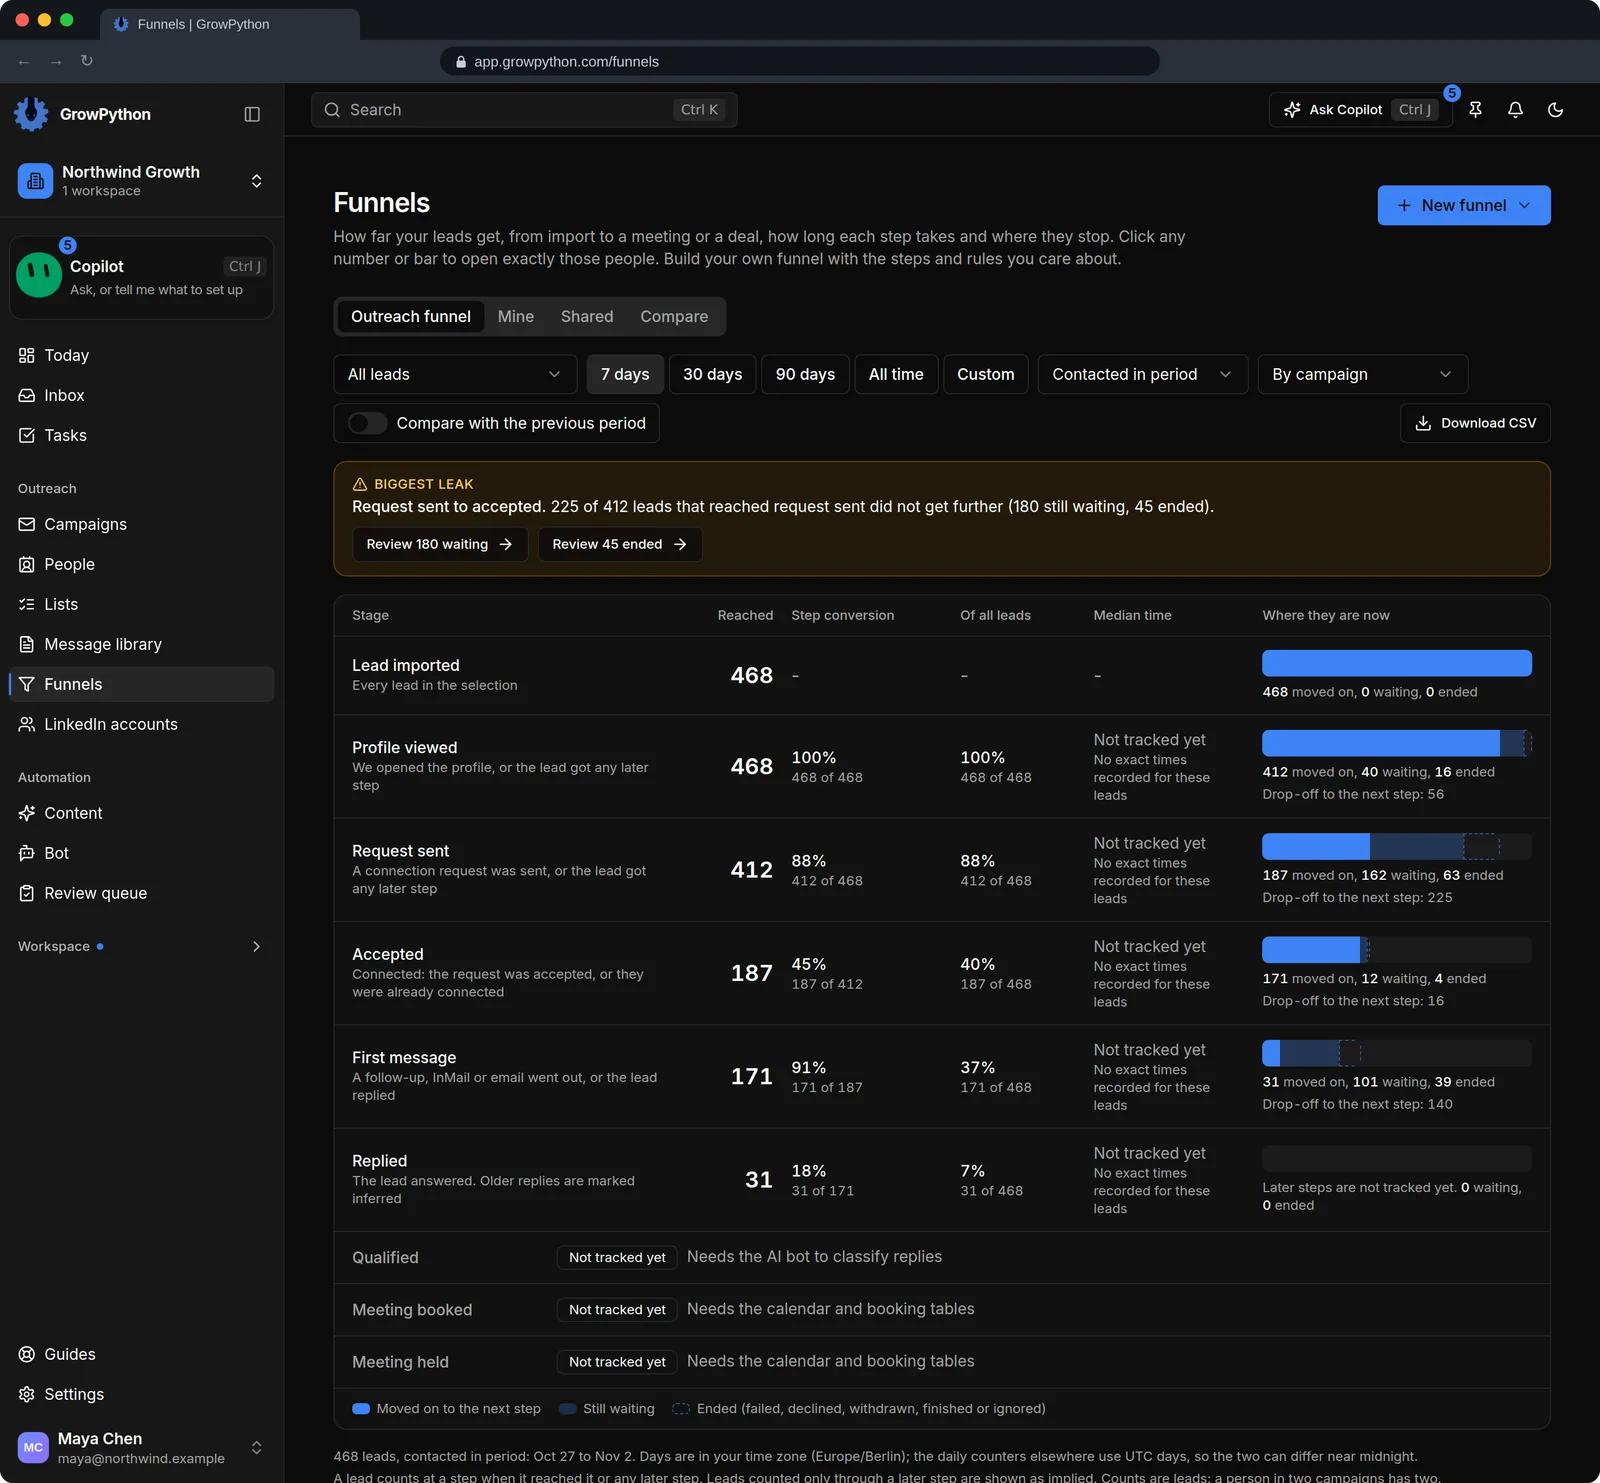
    The Funnels page showing the built-in Outreach funnel for the last 7 days. A highlighted biggest leak says 225 of 412 leads that reached request sent did not get further. The table lists each stage from Lead imported at 468 to Replied at 31 with reached counts, step conversion, share of all leads and a bar for where leads are now.The Funnels page showing the built-in Outreach funnel for the last 7 days. A highlighted biggest leak says 225 of 412 leads that reached request sent did not get further. The table lists each stage from Lead imported at 468 to Replied at 31 with reached counts, step conversion, share of all leads and a bar for where leads are now. Shown in the dark theme.
  3. Saved funnels

    Build your own funnels, share them with the team and compare two side by side.

    The Funnels page showing the built-in Outreach funnel for the last 7 days. A highlighted biggest leak says 225 of 412 leads that reached request sent did not get further. The table lists each stage from Lead imported at 468 to Replied at 31 with reached counts, step conversion, share of all leads and a bar for where leads are now.The Funnels page showing the built-in Outreach funnel for the last 7 days. A highlighted biggest leak says 225 of 412 leads that reached request sent did not get further. The table lists each stage from Lead imported at 468 to Replied at 31 with reached counts, step conversion, share of all leads and a bar for where leads are now. Shown in the dark theme.
  4. Campaign overview

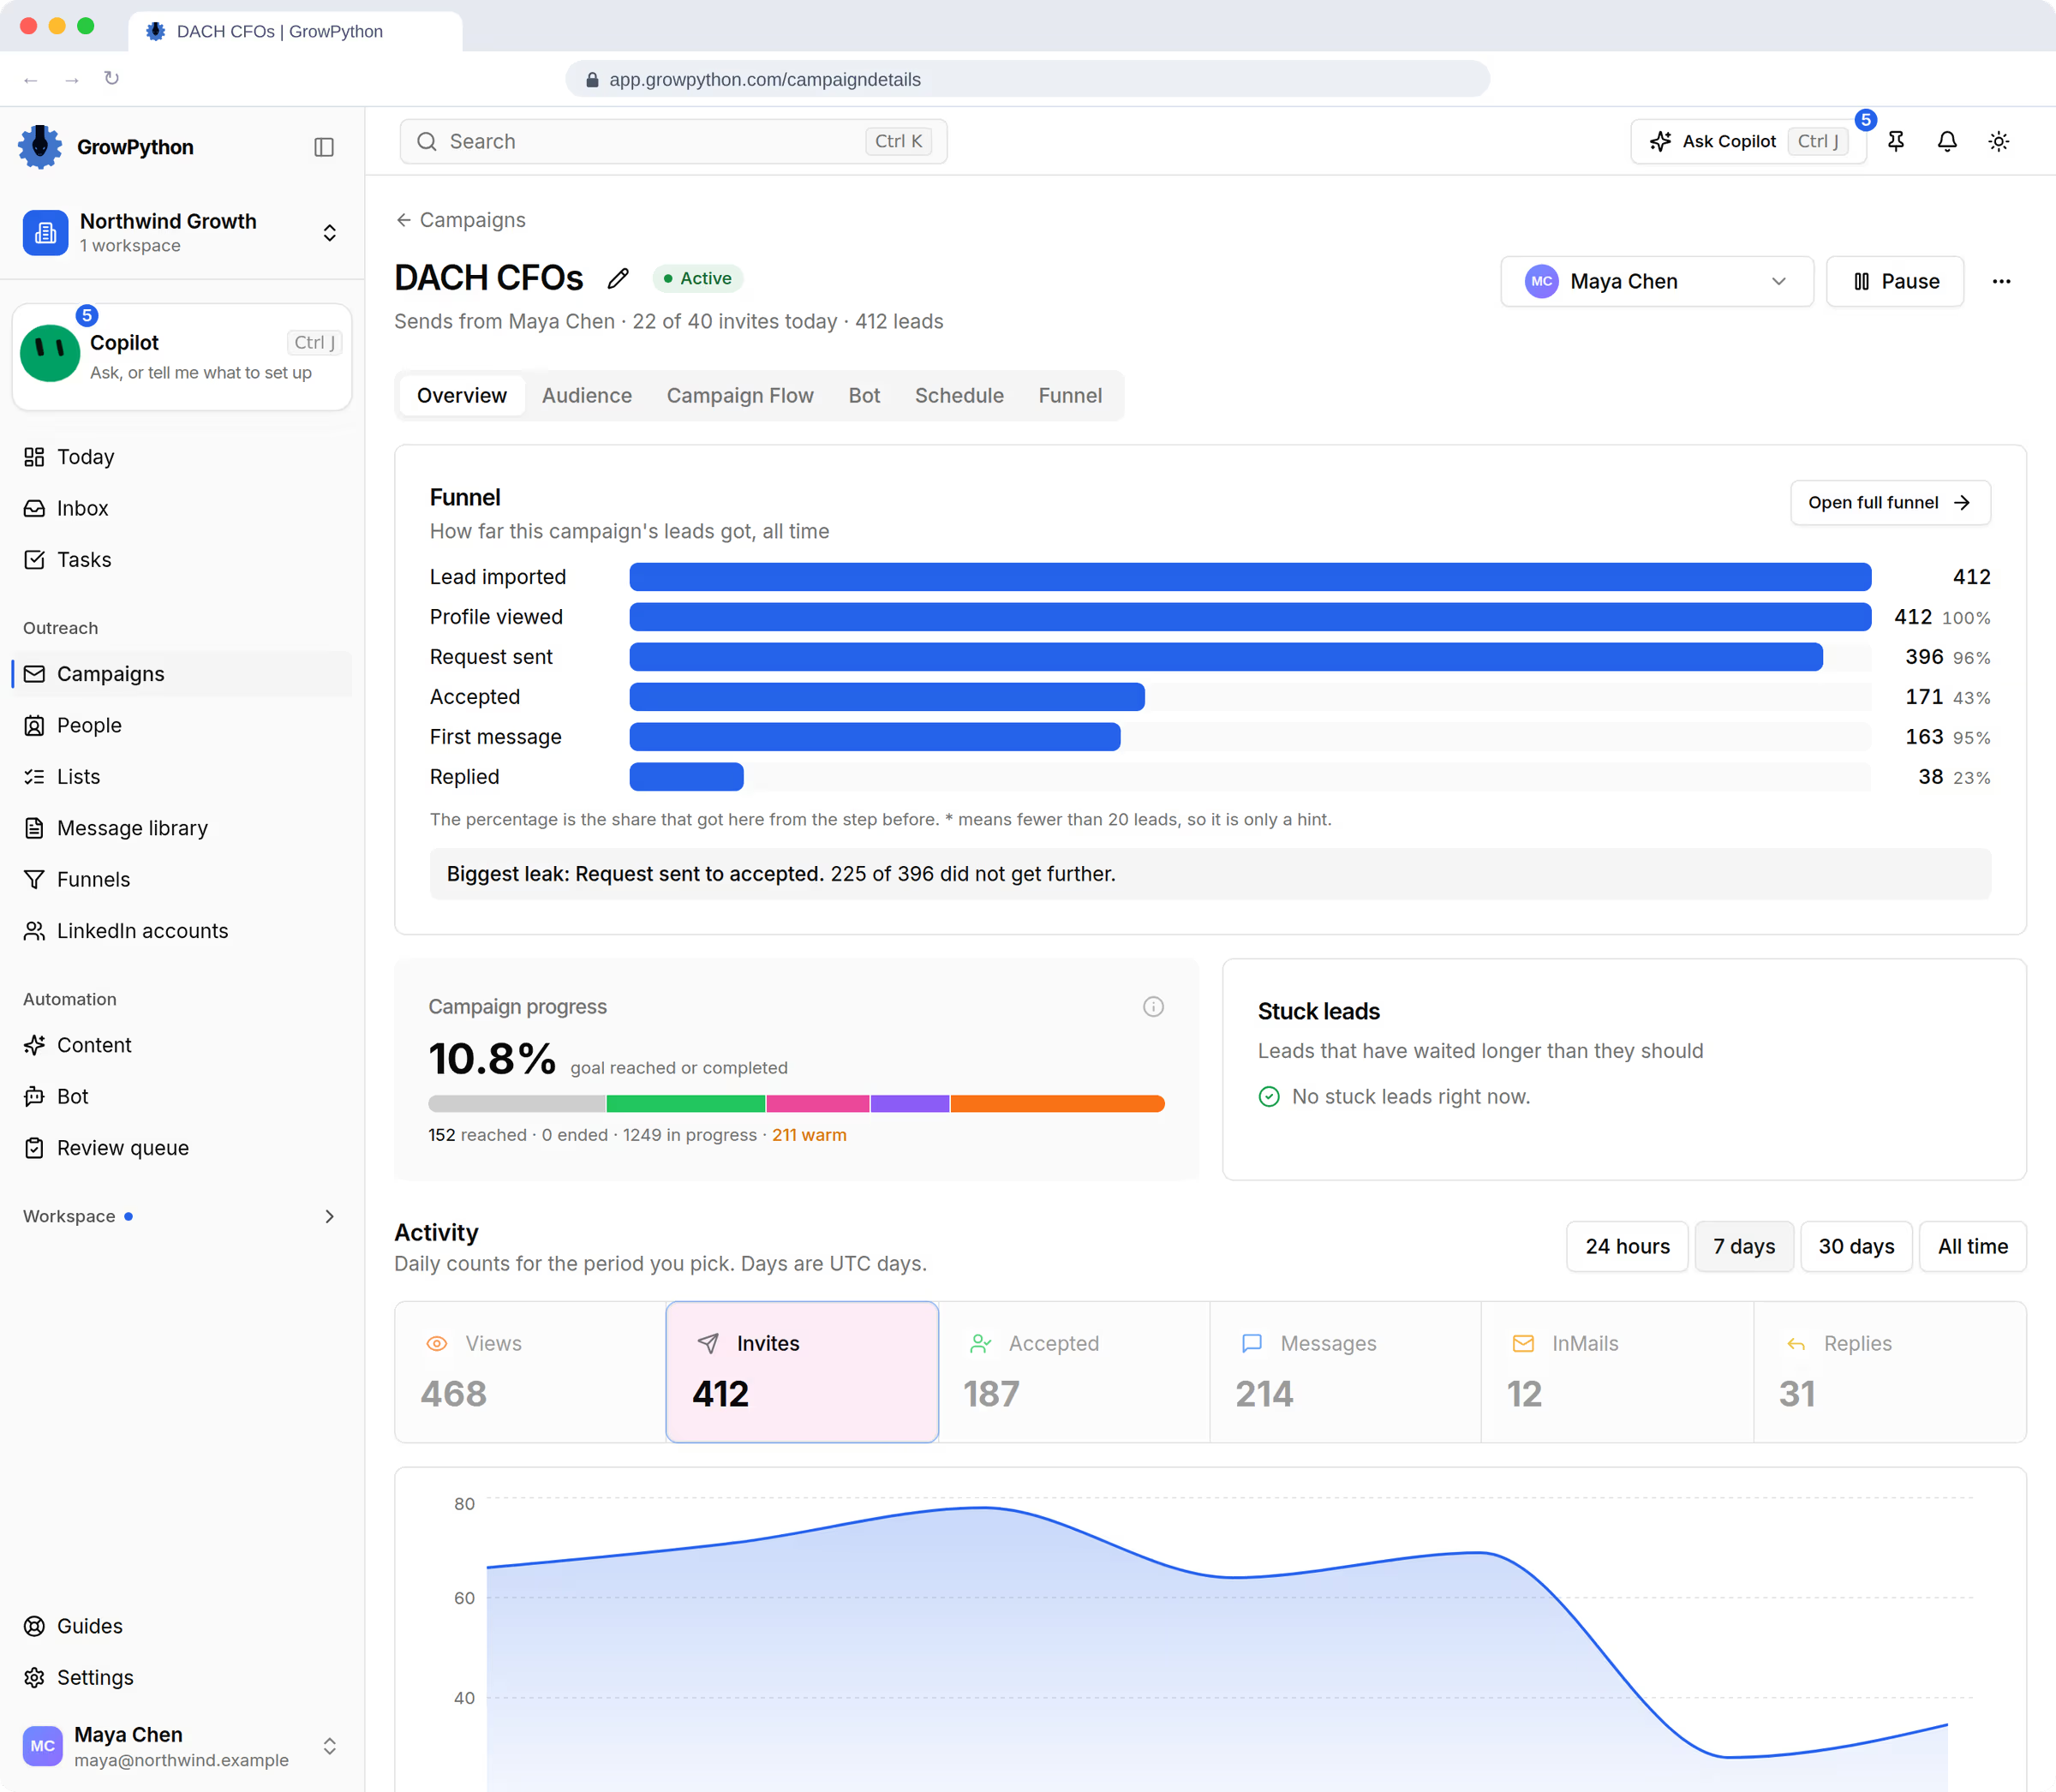
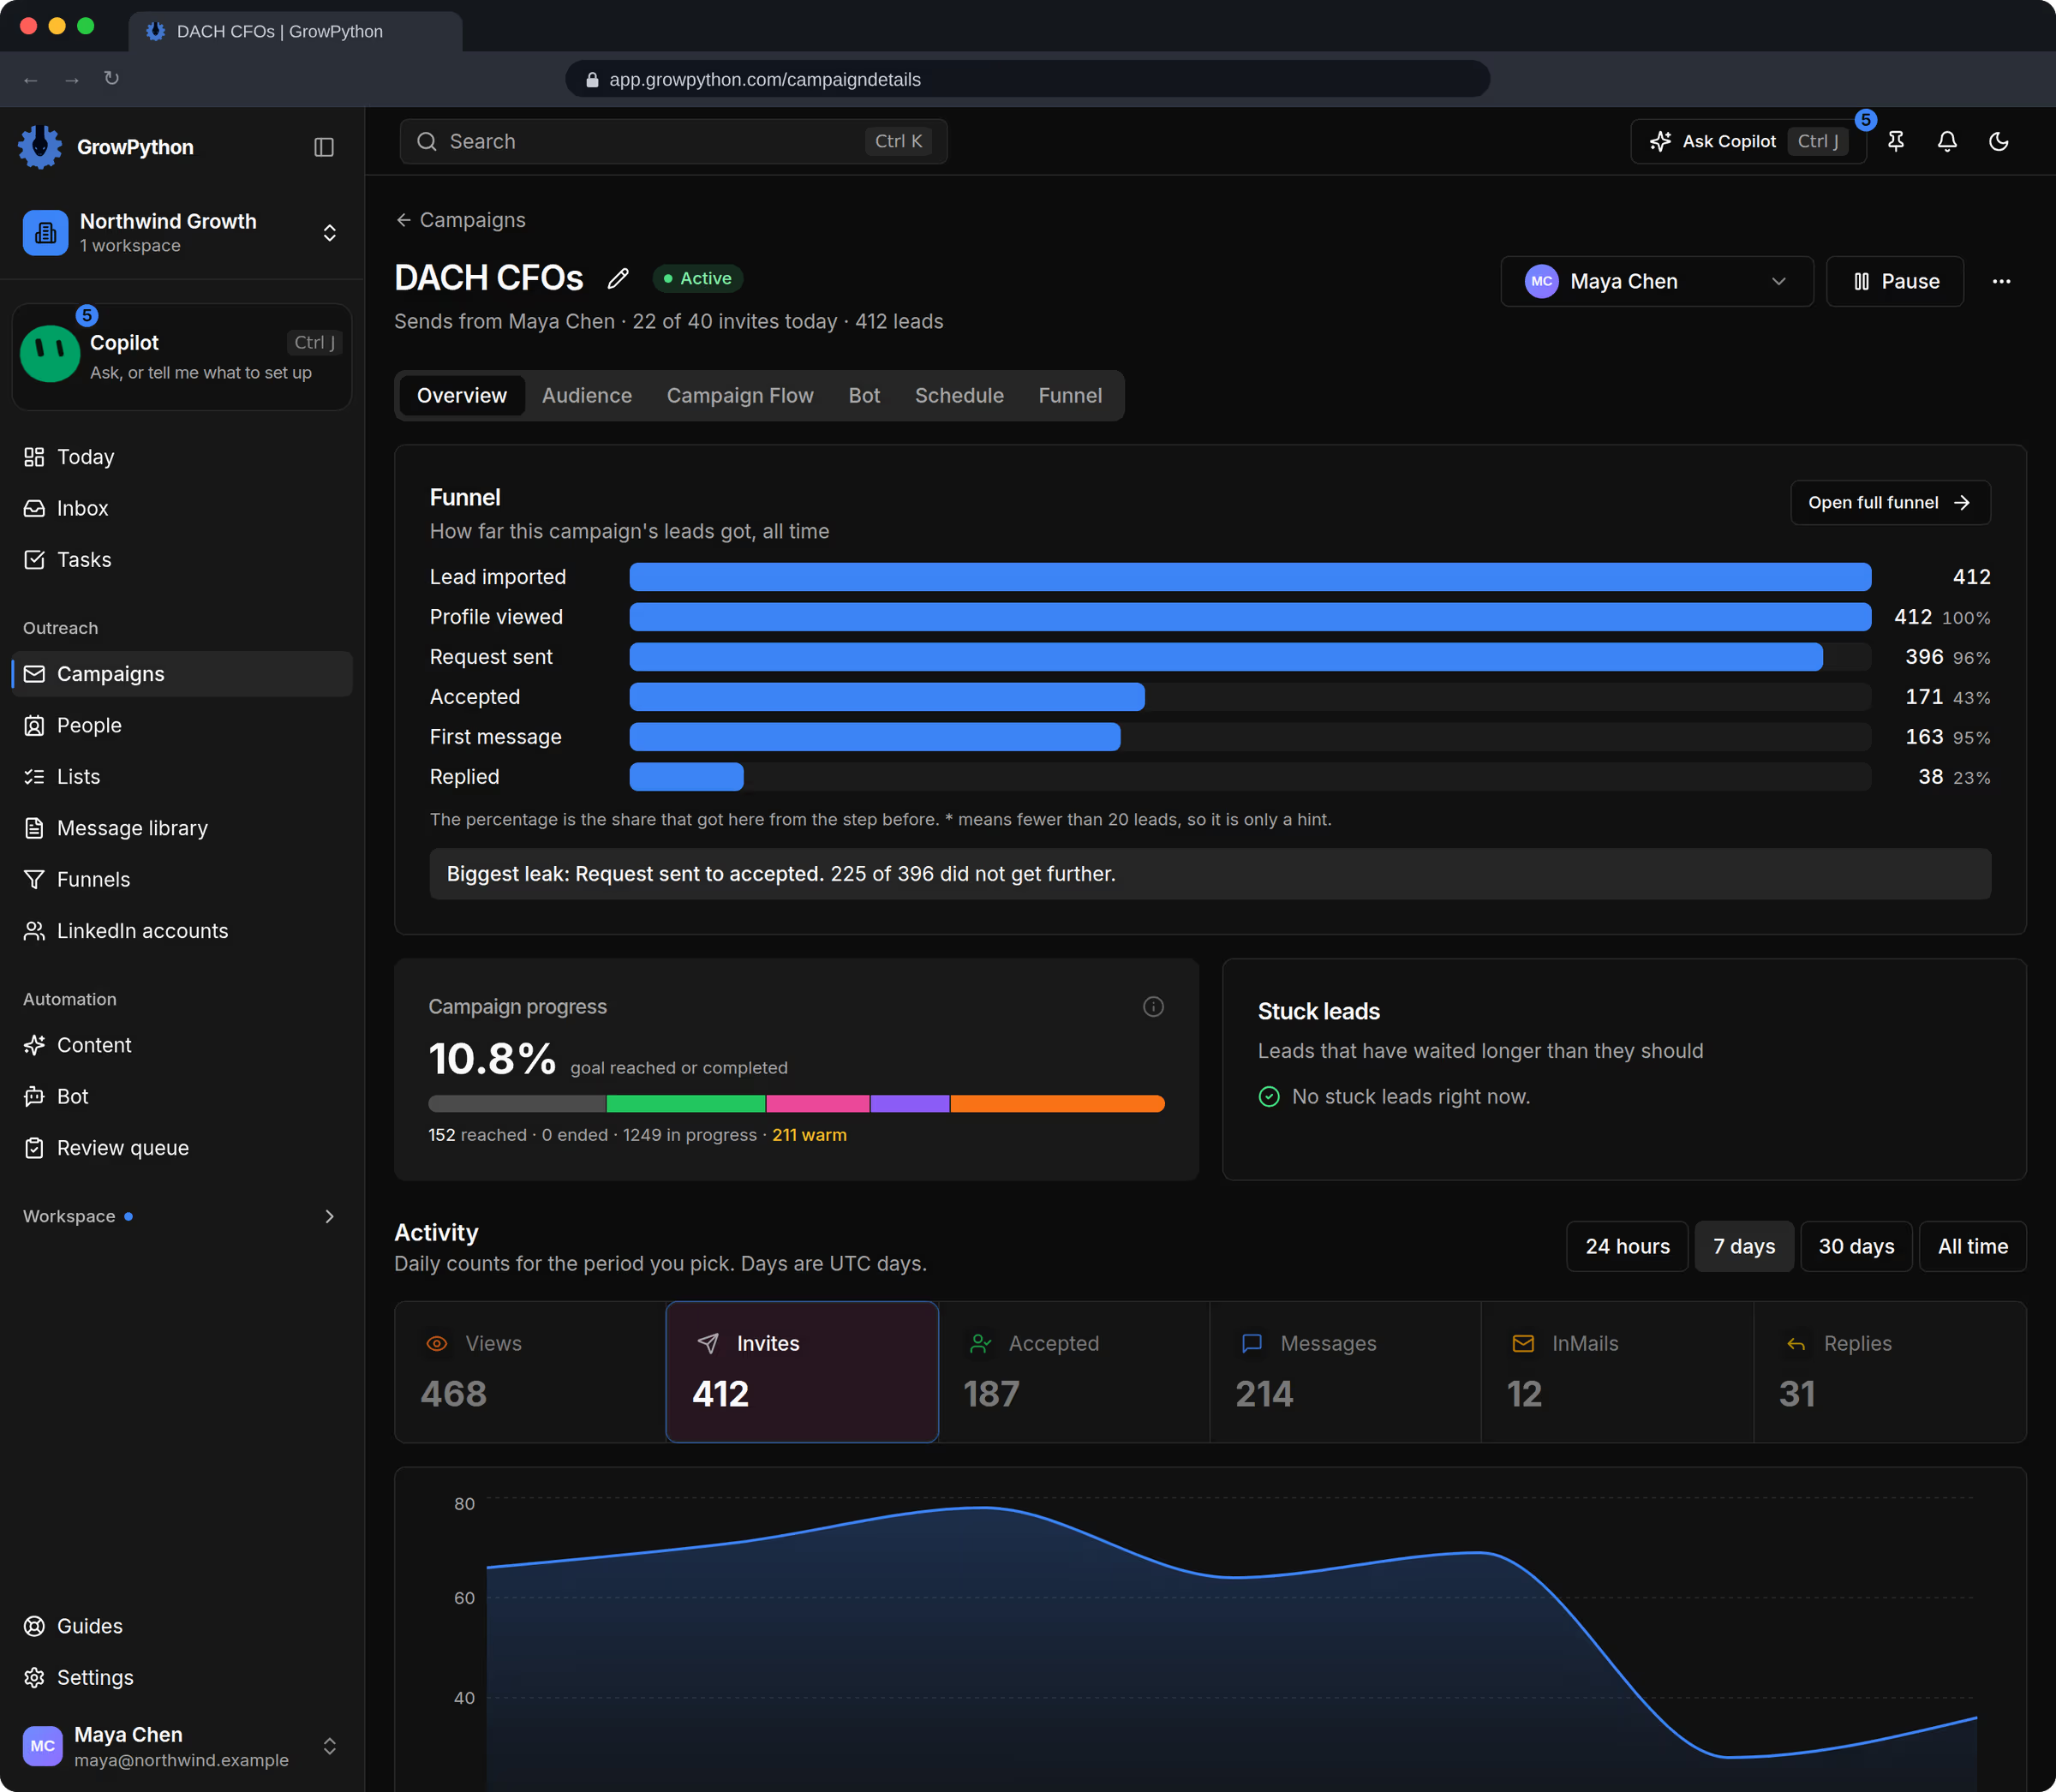
    Inside a campaign, see where every person is: not started, invited, accepted, messaged or replied.
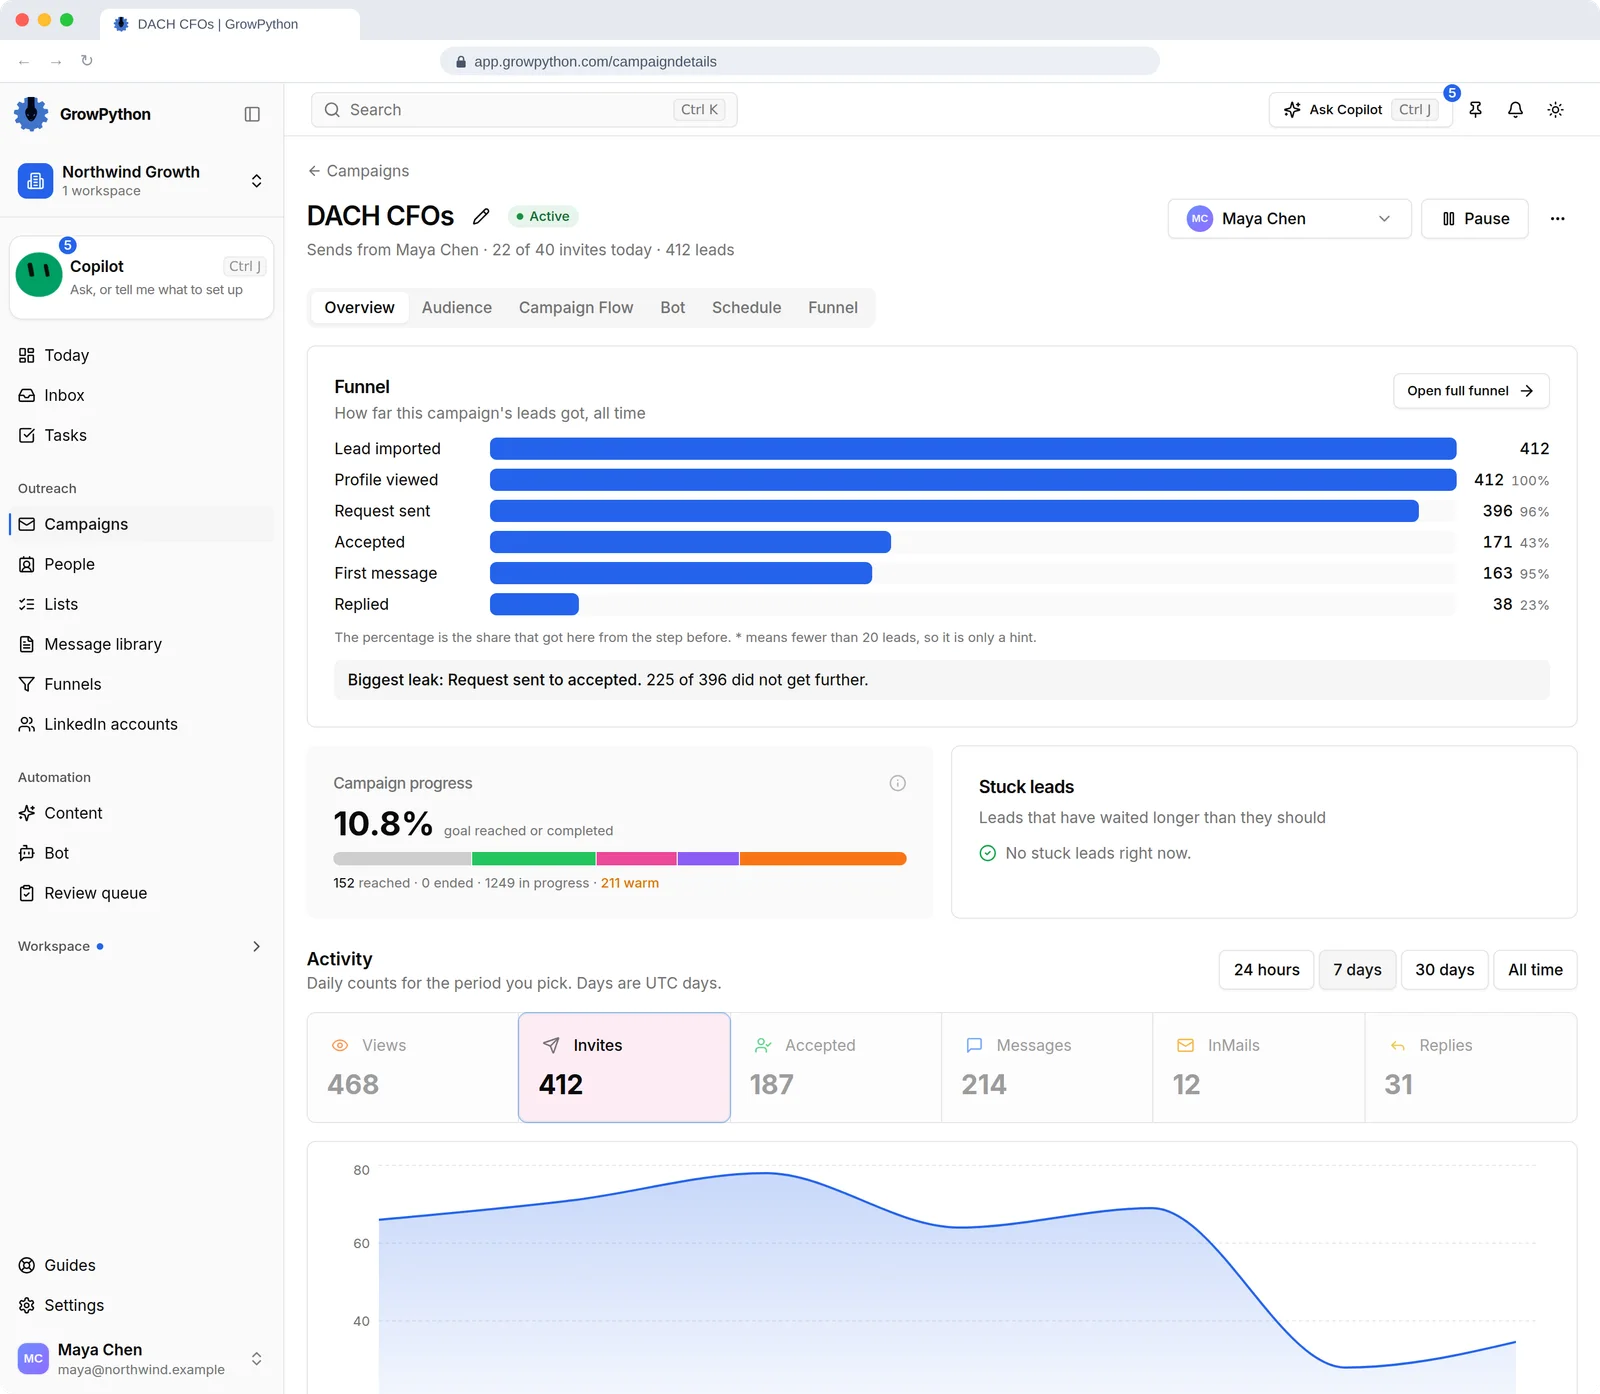
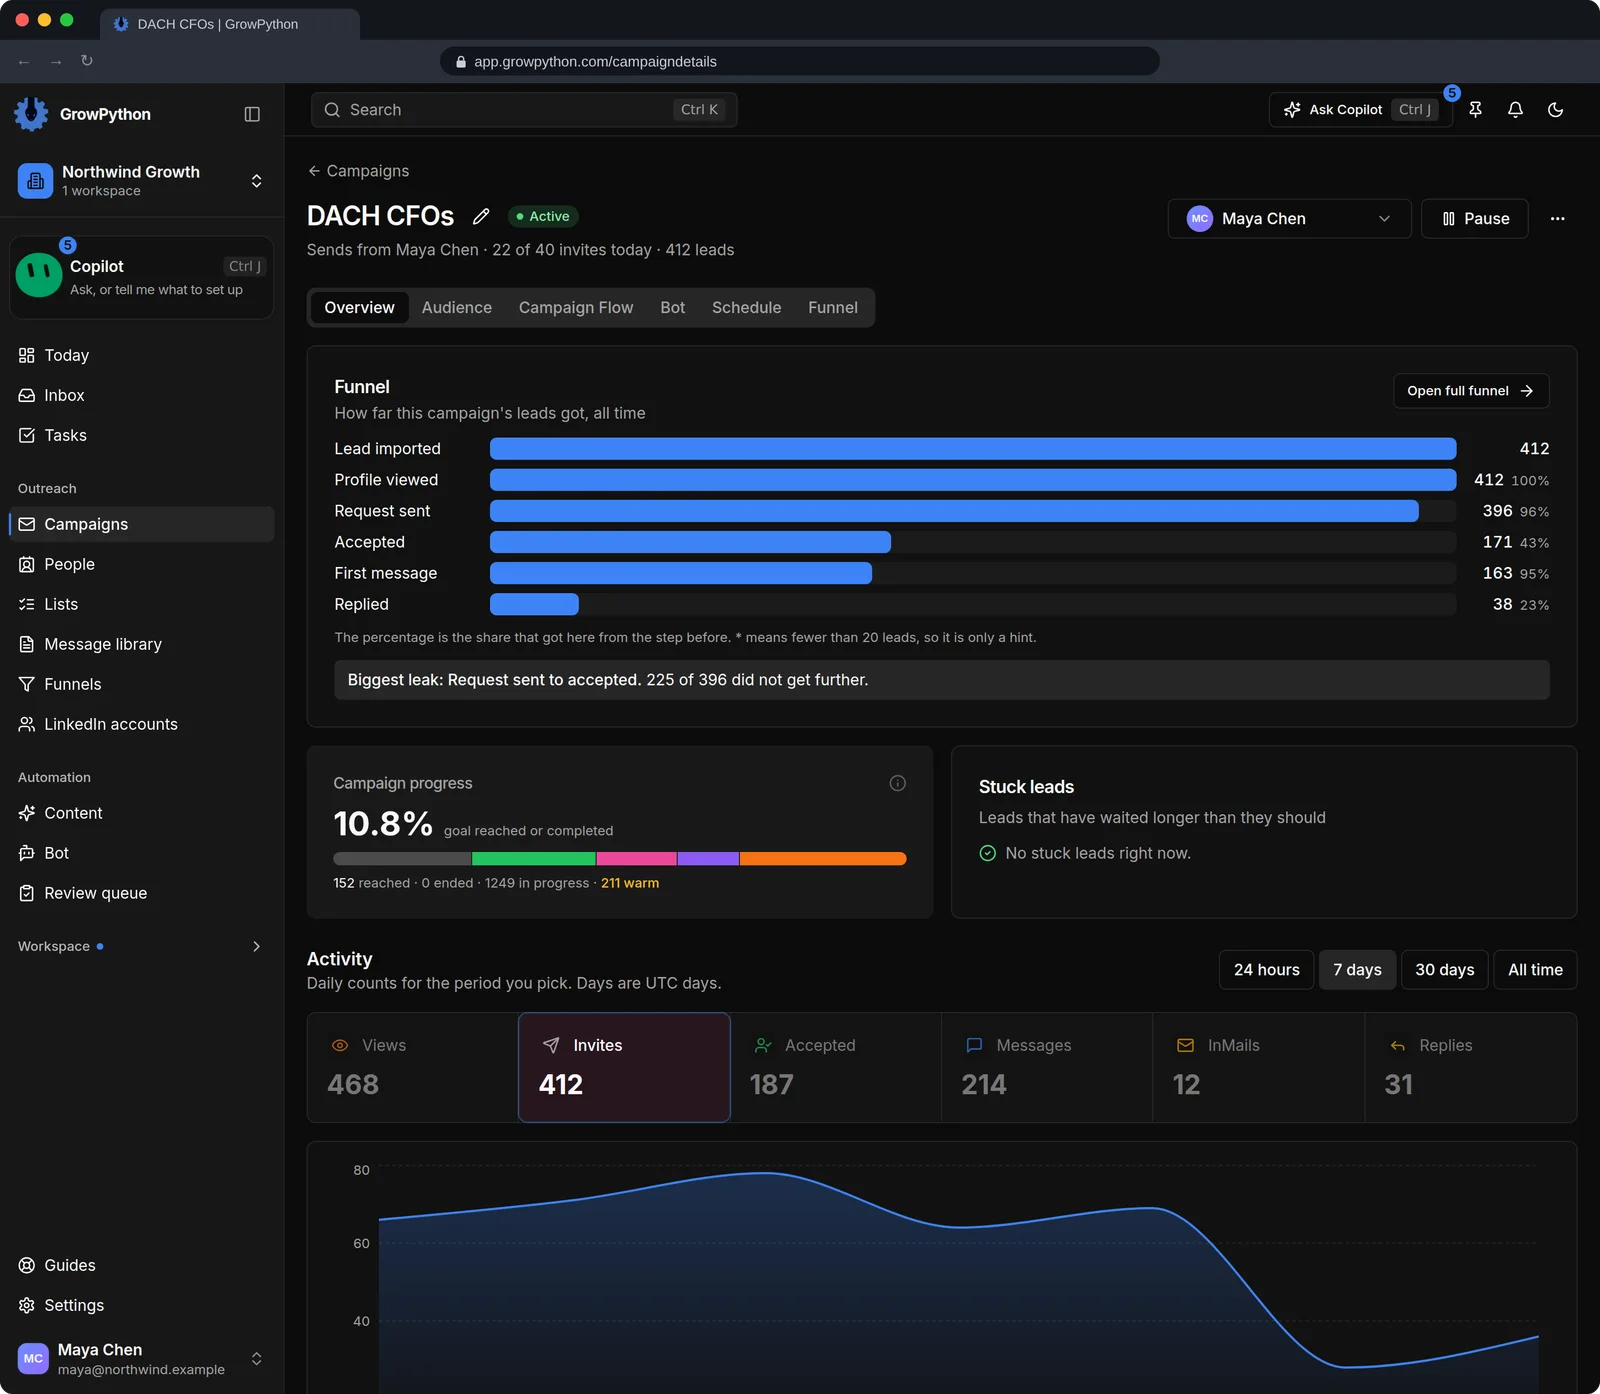
    The Overview tab of the DACH CFOs campaign. It shows a funnel from 412 leads imported to 38 replies with the share at each step, a Pause button, a campaign progress bar, a Stuck leads panel with nothing stuck, and the invites, accepted, messages and replies counts for the last seven days with a chart.The Overview tab of the DACH CFOs campaign. It shows a funnel from 412 leads imported to 38 replies with the share at each step, a Pause button, a campaign progress bar, a Stuck leads panel with nothing stuck, and the invites, accepted, messages and replies counts for the last seven days with a chart. Shown in the dark theme.
  5. Lead grades

    People are graded Elite, Hot, Warm or Cold as they are scored, and lists show the mix.

    The Funnels page showing the built-in Outreach funnel for the last 7 days. A highlighted biggest leak says 225 of 412 leads that reached request sent did not get further. The table lists each stage from Lead imported at 468 to Replied at 31 with reached counts, step conversion, share of all leads and a bar for where leads are now.The Funnels page showing the built-in Outreach funnel for the last 7 days. A highlighted biggest leak says 225 of 412 leads that reached request sent did not get further. The table lists each stage from Lead imported at 468 to Replied at 31 with reached counts, step conversion, share of all leads and a bar for where leads are now. Shown in the dark theme.
  6. Ask why

    Ask the Copilot why replies are low. It looks at your funnel and says what may be holding results back, with how much data the answer rests on.
    The Funnels page showing the built-in Outreach funnel for the last 7 days. A highlighted biggest leak says 225 of 412 leads that reached request sent did not get further. The table lists each stage from Lead imported at 468 to Replied at 31 with reached counts, step conversion, share of all leads and a bar for where leads are now.The Funnels page showing the built-in Outreach funnel for the last 7 days. A highlighted biggest leak says 225 of 412 leads that reached request sent did not get further. The table lists each stage from Lead imported at 468 to Replied at 31 with reached counts, step conversion, share of all leads and a bar for where leads are now. Shown in the dark theme.
The Today page of the GrowPython app for the demo workspace Northwind Growth. A briefing lists three things to do, a Needs you list shows five waiting replies and three drafts to review, four tiles show 412 invites sent, 45 percent accepted, a 14 percent reply rate and four campaigns sending, with an activity chart, an outreach funnel and daily capacity per LinkedIn account below.The Today page of the GrowPython app for the demo workspace Northwind Growth. A briefing lists three things to do, a Needs you list shows five waiting replies and three drafts to review, four tiles show 412 invites sent, 45 percent accepted, a 14 percent reply rate and four campaigns sending, with an activity chart, an outreach funnel and daily capacity per LinkedIn account below. Shown in the dark theme.

How it works

Analytics and funnels

  1. Step 1 of 4

    Start on Today

    Read what needs you and the key numbers.

  2. Step 2 of 4

    Open Funnels

    Choose the workspace, a campaign or a list and a date range.

  3. Step 3 of 4

    Compare

    Put two funnels side by side, for example two campaigns.

  4. Step 4 of 4

    Act

    Change a message or a list, and watch the next week.

Limits and guardrails

What it will not do, and what you should know before you rely on it.

  • Rates are shown with their counts. A small sample says little, so read the number of people behind a rate before you act on it.
  • Numbers come from your own workspace. GrowPython does not benchmark you against anyone and promises no result.
  • A failed load is shown as an error with a Retry button, not as zeros.

Analytics and funnels

More screens

  • Today: what needs you, and whether outreach is healthy.

  • Where your leads stop, with real counts.

  • A campaign's funnel, progress and daily activity in one place.

FAQ

Questions

What does the outreach funnel measure?

How far leads get from import to a reply, a meeting or a won deal, for the whole workspace, one campaign or one list.

Can I build my own funnel?

Yes. Saved funnels are built with a builder, can be shared with the team and can be compared side by side.

Does it show industry benchmarks?

No. It shows your own numbers with the counts behind them.

Where do I see how much an account has sent?

The account settings show its limits, and Today has a Capacity today card for each LinkedIn account.

Ready to run client acquisition from one place?

Start your free trial, connect an account and build a small list first.

5-day free trial for new customers